
Build Custom Dashboards with GARY
GARY generates custom user interfaces and dashboard screens directly from natural language descriptions. Describe the layout, components, or data you want to visualize and GARY produces a fully rendered interface — no front-end development skills required. What used to require a developer and a sprint cycle now takes a conversation.
How It Works
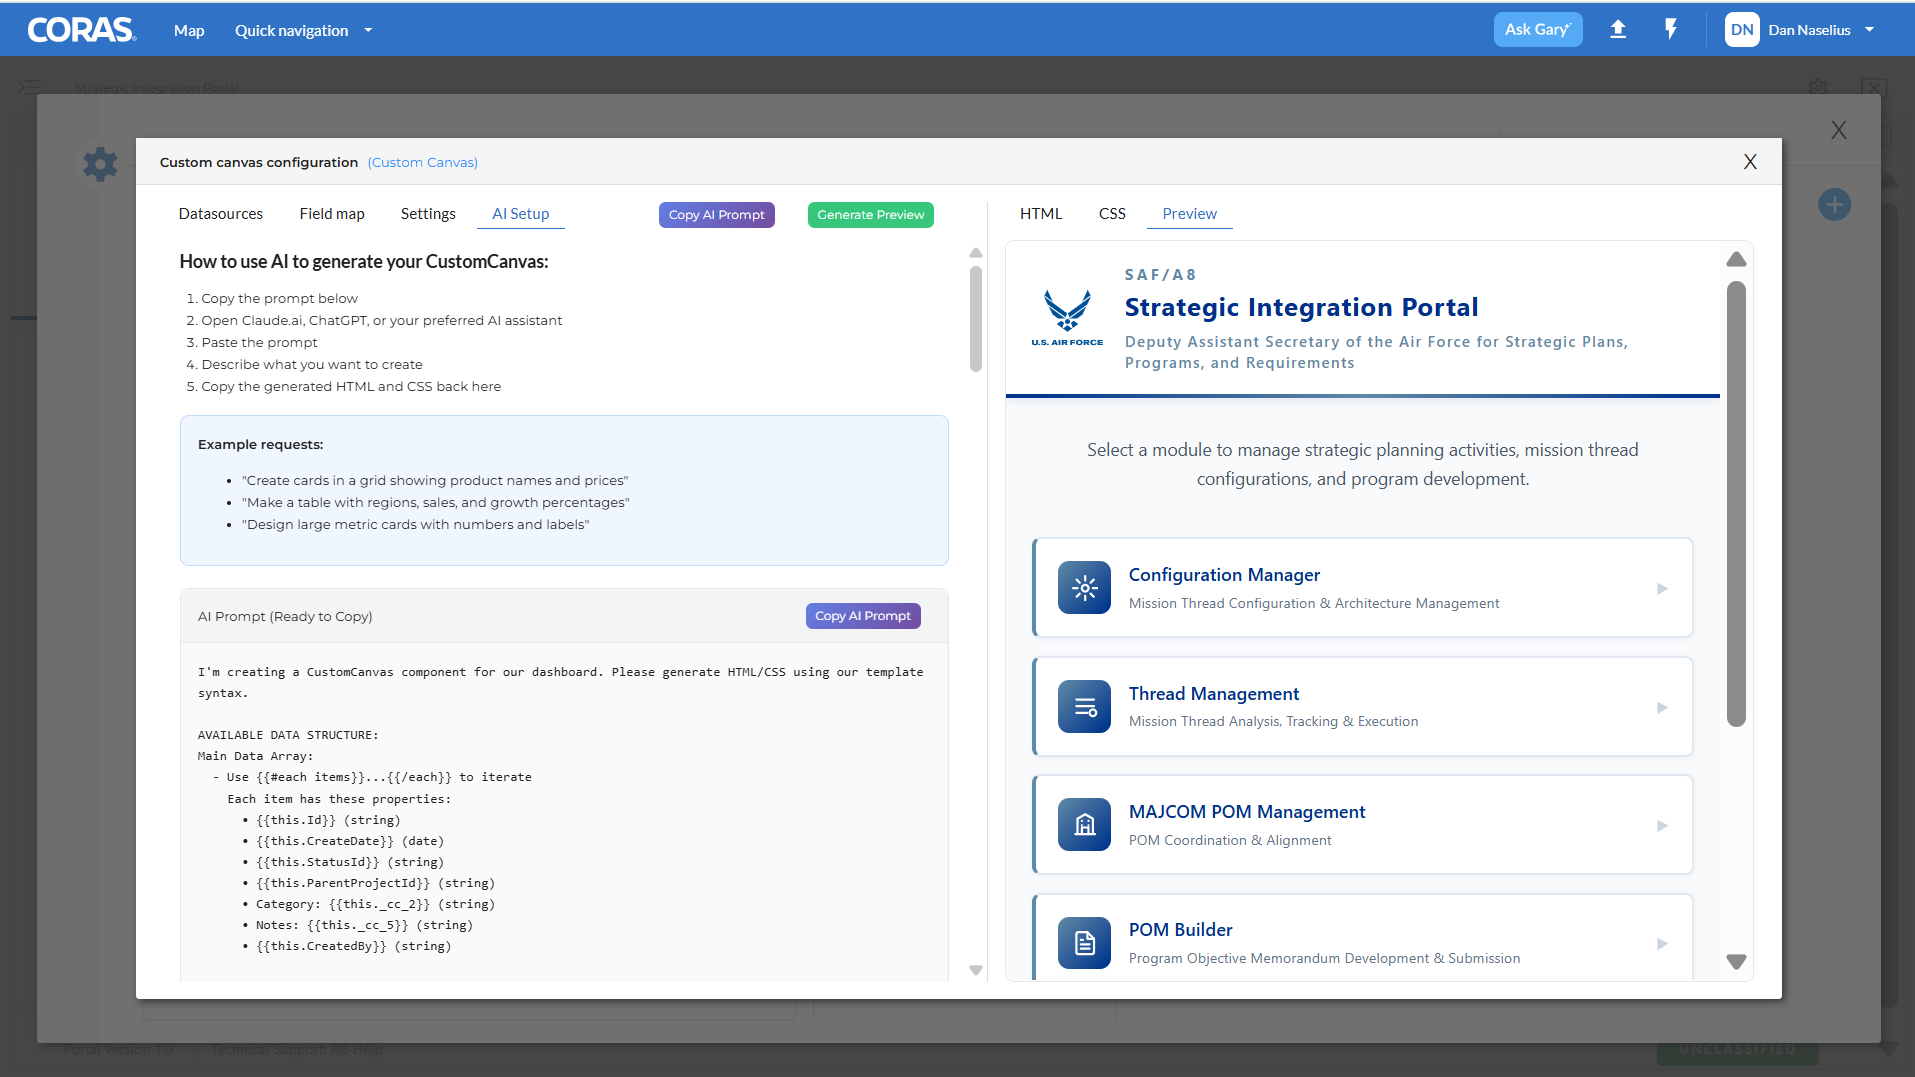
GARY uses a Custom Canvas configuration where you describe what you want in plain English. GARY generates the HTML, CSS, and a live preview in real time, letting you iterate on dashboard designs instantly. Change the layout, swap a component, adjust the data — just ask GARY to update it.
Key Capabilities
Natural language to UI: Describe what you want -- GARY builds it. No coding required. No design tools. No developer handoff.
Live preview: See the generated interface in real time across three tabs: HTML, CSS, and Preview. Review the output and refine it in the same conversation.
Data-aware components: GARY understands your CORAS data structure and creates components that connect directly to live data — not static mockups.
Reusable prompts — Save the prompts that produce the interfaces your team uses most. Share them across the organization so anyone can generate consistent dashboards without starting from scratch.
Example Requests
Not sure where to start? Try describing what you need in plain language:
"Create a dashboard showing program readiness rates by squadron"
"Build a metrics card displaying obligation rate versus target"
"Make a table with all active contracts sorted by period of performance end date"
"Design a grid of KPI cards showing TRL status, funding alignment, and schedule health"
"Create a summary view for leadership showing top 5 programs by spend"
Next Step
For GARY-generated analytical reports and exportable dashboards, see Agentic Data Transformation.
Get Help
Contact your Customer Success Manager or visit the Customer Resource Center for additional support with Custom Canvas and dashboard configuration.